
By 2005, a pattern-recognition talk could move easily between a laptop, a PowerPoint deck, a live MATLAB demonstration, and a proceedings PDF. That practical shift mattered. It made results easier to show, encouraged richer visual evidence, and changed what audiences expected. Tracking or recognition systems were no longer judged solely by equations and error-rate tables; increasingly, researchers were expected to show how they behaved.
The technology remained uneven. Wireless networking failed often enough to be distrusted, projector resolution could obscure fine detail, and presenters commonly carried talks on USB drives with CD-ROM backups. Even so, the conference setting was becoming recognizably digital. The change was particularly visible in fields where demonstrations had real explanatory value: speech systems, document analysis, visual tracking, stereo reconstruction, biometric recognition, and medical image computing.
From transparencies to portable digital talks
The move away from overhead transparencies had begun earlier, but by 2005 digital projection was close to standard practice at major technical meetings. Laptops were common enough among researchers, presentation software was familiar, and organizers increasingly planned for projection rather than slide projectors. The result was more than cleaner slides: it expanded the material a researcher could reasonably bring into the room.
Transparencies worked well for diagrams, equations, and static photographs. Digital decks could include animation, color-coded plots, short video sequences, waveforms, spectrograms, scanned manuscript samples, and prototype-interface screenshots. None of this was entirely new, but it had previously been harder to transport and less reliable to present. By 2005, it was routine enough to shape how talks were designed.
The limits of the standard conference projector
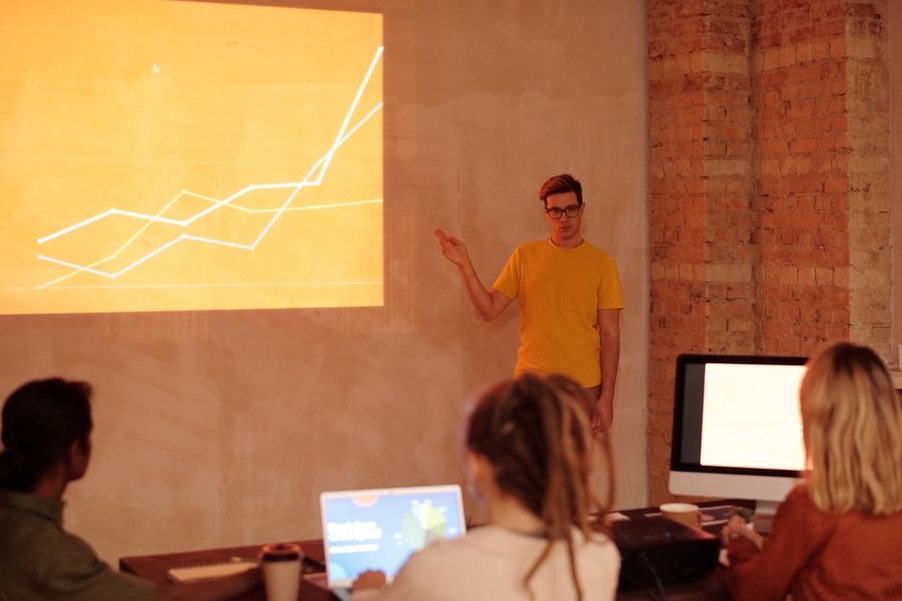
Routine did not mean trouble-free. In many rooms, projector brightness and effective resolution made dense figures difficult to read. Fine lines in precision-recall graphs, small labels in confusion matrices, and several document-analysis examples on one slide could vanish for anyone sitting near the back. Color helped, but red-green distinctions were a poor choice for both viewers and imperfect projectors.
Experienced presenters made practical adjustments:
- They enlarged axes, labels, and key numerical results instead of dropping in a journal figure unchanged.
- They spread complicated pipelines across several slides and revealed stages gradually.
- They kept a static image or pre-recorded clip for every live demonstration.
- They did not depend on venue internet access for essential material.
- When possible, they tested fonts, display scaling, video codecs, and adapters on the supplied machine.
These were more than presentation niceties. A tracking talk could fail if its bounding box was too thin to see. A speech-recognition presentation could lose its main evidence if the waveform or transcript was illegible. Display limits affected what audiences could treat as convincing evidence.
Multimedia made temporal evidence presentable
Computer vision and speech research benefited naturally from projected multimedia. A paper could describe a sequence, but a short clip made a system’s behavior immediately clear. Tracking researchers could show a target through occlusion, motion blur, changing illumination, or background clutter. Speech presentations could pair an audio sample with recognition output, an alignment display, or synthesized speech.
That did not replace quantitative evaluation. A favorable video clip can hide an algorithm’s weak points, and a selected speech sample may sound better than typical system output. Strong presentations treated multimedia as qualitative evidence alongside benchmarks: a way to reveal behavior that aggregate scores did not fully describe. A tracker might post acceptable average overlap while repeatedly switching identities; a word error rate might reveal little about usefulness for a particular accent, microphone, or domain.
The format also changed the questions audiences asked. Rather than asking only which classifier produced the lowest error rate, attendees could ask why an approach failed on a particular frame, whether a segmentation boundary was anatomically plausible, or how an acoustic model handled out-of-vocabulary words. Conferences remained places for reporting claims and results, but they also became places where systems could be inspected in motion.
Live demonstrations: compelling, fragile, and increasingly expected
Live demonstrations held a special place in 2005. They implied that a technique had moved beyond an offline experiment into a working system. A speaker might show a camera tracking a face, software locating text regions in a page image, a recognizer transcribing spoken commands, or a visualization tool moving through volumetric medical data. Such demonstrations stayed with audiences because computation became an event rather than a finished figure.
They were also fragile. Laptop batteries, external-camera drivers, audio levels, operating-system differences, projector settings, and network permissions could derail a short slot. A system trained on controlled laboratory material might behave unpredictably in a bright lecture hall or with an unfamiliar microphone. For speech work and research on low-resource languages, the venue’s acoustic conditions could themselves distort the demonstration.
Researchers who came prepared treated a live demo as one layer of evidence, not the foundation of the talk. They brought screenshots, video captures, and saved outputs from earlier experiments. This was prudent, but also scientifically useful: it distinguished the reproducible experimental record from the changing conditions of a conference room.
Proceedings, CD-ROMs, and the early digital archive
The conference paper remained the archival unit, though its delivery was changing. Printed proceedings persisted, especially at established meetings, but CD-ROM editions were widespread by the middle of the decade. They reduced shipping weight and printing costs while allowing hundreds or thousands of searchable PDF pages, supplementary files, and sometimes video or software to travel with attendees.
Digital proceedings changed how people read during a meeting. Instead of photocopying a paper or marking up a printed volume, participants could search by author, keyword, or method and open a PDF on a laptop. The experience had clear limits: search depended on the quality of the files, large collections were awkward to browse, and long-term access relied on physical media and later migration. Still, the proceedings CD was an important step between paper-bound records and the web-centered archives that later became standard.
| Presentation component | Typical 2005 use | Research consequence |
|---|---|---|
| Digital projector | Slides, color figures, animated pipelines | More visual explanation, but strong pressure to simplify figures |
| Laptop computer | Portable authoring and presentation platform | Enabled personal workflows while introducing compatibility risks |
| Short video or audio clip | Tracking, speech, gesture, recognition demos | Made temporal behavior inspectable beyond summary metrics |
| CD-ROM proceedings | Distribution of searchable paper collections | Accelerated access during the meeting and reduced print dependence |
| Early online access | Program pages, PDFs, updates, registration information | Extended a meeting’s reach but did not yet guarantee stable access |
Poster sessions as technical interfaces
Posters were not displaced by digital presentation. In many fields, they remained the best setting for detailed technical exchange. A poster could show a full pipeline, larger collections of qualitative examples, error analyses, and implementation details that would overwhelm a 15- or 20-minute talk. A presenter's laptop often sat beside the poster, creating a hybrid format in which printed explanation was supported by code, video, data visualizations, or a working prototype.
This mattered for early machine-learning methods, where apparent performance gains could depend heavily on preprocessing, feature selection, training-test splits, or parameter choices. A visitor could point to a result, ask for a failure case, and inspect a sequence at a pace impossible in an auditorium. Poster conversations often surfaced methodological details that formal papers had to compress or leave out.
For smaller research communities, that conversational role was especially valuable. Research on under-resourced languages, for example, often depended on bespoke data collection, scarce annotated corpora, local orthographic conventions, and evaluation decisions that could not be reduced to one benchmark number. The later history of such communities is explored in Decoding the 24th Paper in PRASA 2011: A Snapshot of Under-Resourced Speech Research, a useful reminder that proceedings preserve both technical results and the constraints under which they were produced.

What “conference-ready” meant for vision and speech systems
In 2005, preparing work for a conference often meant turning a research pipeline into a visual narrative that an audience could follow. The methods might involve support vector machines, hidden Markov models, Gaussian mixture models, boosting, graph-based optimization, optical flow, local descriptors, or statistical language models. The task was to make each component’s role understandable without burying the audience in implementation detail.
Computer vision and imaging
Vision presentations benefited from side-by-side comparison. A slide could place an input image next to segmentation masks, feature correspondences, depth maps, tracking trajectories, or final classifications. This was particularly helpful where a method addressed ambiguity rather than simply producing a final label. In stereovision, an audience could inspect textureless regions, occluded boundaries, and disparity discontinuities directly. The technical and historical reasons dense stereo became prominent again in this period are considered in Why Dense Stereo Reconstruction Returned to the Forefront in the Mid-2000s.
Medical-image analysis brought an ethical and interpretive issue into view. A colorful overlay could make a segmentation appear authoritative even when it was uncertain or clinically incomplete. Careful presenters distinguished an algorithmic region of interest from a diagnosis, described the imaging modality and dataset conditions, and showed failure cases when feasible. Those choices reduced the risk that a polished visualization would claim more than the research supported.
Speech, language, and audio
Speech talks faced a different problem: sound is sequential, while a conference room is not an acoustic laboratory. Presenters used short, clear clips, waveforms and spectrograms, forced-alignment displays, recognition hypotheses, and concise error breakdowns. For synthesis, listeners could compare natural and generated speech, though the value of such a comparison depended on speaker placement, room acoustics, and reliable file playback.
Language identification and low-resource speech research often required further context. Results could vary with the amount of training speech, channel mismatch, transcription conventions, code-switching, and the distinction between closely related languages. A responsible 2005 presentation stated these conditions rather than treating one accuracy percentage as universally meaningful. Technical communities were learning that a benchmark could be useful without representing every real linguistic condition.
Networking technology changed the meeting’s boundaries
Conference websites, email announcements, and downloadable program updates were already common enough to affect attendance and planning. The meeting was not continuously connected in the later sense, however. Wireless access could be expensive, overcrowded, limited to particular rooms, or unavailable. Researchers still exchanged files directly, wrote down URLs, carried physical media, and relied on paper schedules.
That uneven connectivity made physical attendance unusually valuable. A hallway conversation could lead to the exchange of data, code, a preprint, or a demonstration that was not easily available online. The conference functioned as both a publication venue and an infrastructure for trust. Attendees could ask how a dataset had been labeled, whether a baseline had been reimplemented faithfully, or whether a prototype could hold up outside laboratory conditions.
For archival work, the practical lesson is straightforward: when examining a 2005 paper or slide deck, record the conference name, dates, session, proceedings version, and any stated dataset or software dependencies before comparing its results directly with later work. A projected clip, a PDF on a CD-ROM, and a final journal article may document materially different stages of the same system.