
A scanned page can contain perfectly legible letters and still fail as a usable document. A two-column article may be read across the columns, a table may lose its rows, a footnote may be folded into the main text, and a handwritten correction may be dismissed as noise. By the 2000s, that distinction was central: optical character recognition generated character hypotheses, while document analysis attempted to recover a page’s organization, meaning, and intended reading order.
The difference mattered because institutions were digitizing far more than clean, single-column books. Libraries dealt with historical newspapers and bound volumes; businesses processed invoices, forms, and correspondence; governments maintained archival records; researchers worked with technical papers containing equations, plots, tables, and references. Before a system could recognize a region as text, it had to determine what kind of region it was.
From character strings to structured pages
OCR had long been treated as a pattern-recognition problem: divide an image into plausible symbols, extract visual features, and assign labels. During the 2000s, OCR engines increasingly combined statistical language models with visual evidence, allowing plausible word sequences to outweigh isolated character guesses. That did not solve page structure. The word “Total” on an invoice serves a different purpose from the same word in a letter or a table caption.
Document analysis treated a page as several interacting layers:
- Physical appearance: skew, blur, bleed-through, stains, folds, uneven illumination, and scanner artifacts.
- Layout: columns, margins, headers, footers, text blocks, images, tables, captions, and separators.
- Textual content: words, lines, paragraphs, scripts, languages, and reading order.
- Document semantics: fields in a form, authors and titles in an article, cells in a table, or entities such as dates and amounts.
This was more than an elaborate preprocessing step. Errors at one layer spread into the next. If a page was not deskewed, line detection became unreliable. If columns were merged, recognition could produce an intelligible but wrongly ordered stream of text. If table boundaries were missed, numbers might be linked to the wrong labels.
The practical pipeline around OCR
Most systems used a staged workflow, though the order varied by material and researchers increasingly investigated joint optimization. Binarization converted a gray-scale scan into a foreground-background representation. Global thresholds were often sufficient for evenly lit modern print, but old paper and photographed pages frequently needed local or adaptive thresholding. Methods associated with Sauvola and Niblack calculated thresholds from nearby pixel statistics, preserving faint strokes without mistaking paper texture for characters.
Deskewing often followed, or operated alongside, segmentation. Projection profiles—the horizontal and vertical sums of dark pixels—could suggest an orientation because properly aligned text created regular peaks. Connected-component analysis grouped touching foreground pixels into candidates for letters, words, or graphic regions. Morphological operations such as dilation and erosion then joined or separated components according to their spatial arrangement.
Why segmentation dominated performance
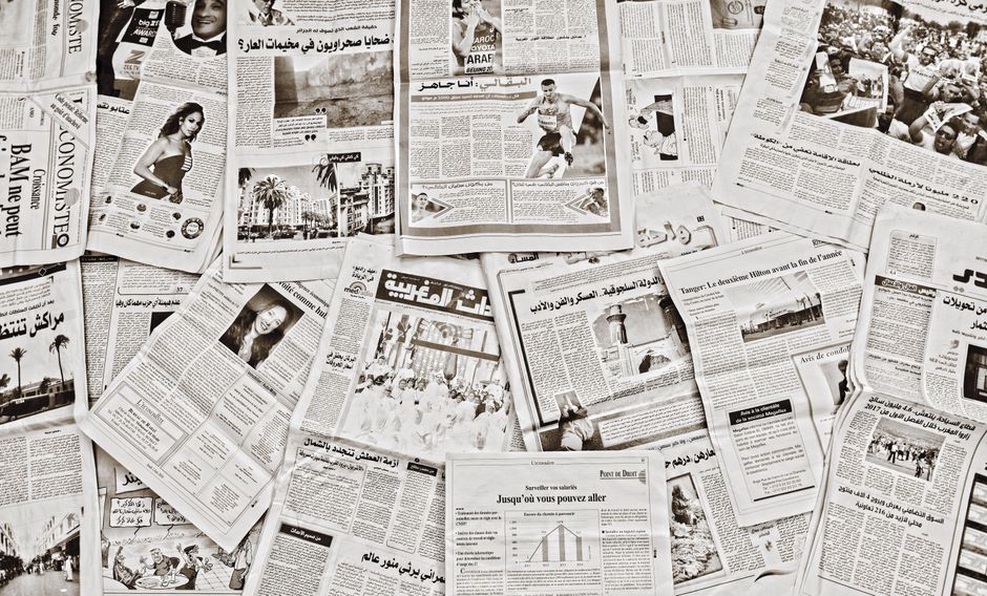
On a clean business letter, connected components and whitespace cues could work well. Complex pages needed richer models. The XY-cut method recursively split a page along broad blank horizontal or vertical gaps. It was computationally simple and useful when rectangular blocks were separated by whitespace, yet it struggled with touching zones, irregular advertisements, and pages whose reading order did not follow a simple geometric partition.
Another group of methods relied on connected-component geometry: size, density, alignment, inter-word spacing, and relationships with nearby components. Elements with similar statistics could be grouped into text lines or blocks, while unusually large or dense areas could be classified as illustrations. Researchers also used texture-based classification, since a paragraph, halftone photograph, and line drawing produce different local spatial patterns even before individual characters are recognized.
The goal was a page model rather than a loose collection of bounding boxes: a hierarchy of regions, lines, words, and sometimes logical roles. That model could constrain recognition. A caption beneath an image might be processed as a single block; an equation could be sent to a specialist recognizer or retained as an image; a repeated page header could be marked as running matter rather than article content.
Reading order was an interpretation problem
Human readers rely on typography, convention, and meaning to make sense of a page. Early document systems had to approximate those judgments from coordinates. A simple top-to-bottom, left-to-right rule failed on newspapers, scientific articles, bilingual documents, and pages with marginal notes. Even a conventional article places titles, author names, abstracts, main columns, figures, and references according to different spatial rules.
Graph-based methods offered one answer. Regions or lines became nodes, while edges represented likely “comes before” relationships based on alignment, distance, overlap, and page direction. The system then searched for a consistent order. Such methods did not remove ambiguity, but they exposed it: several possible orders could be scored rather than silently assumed.
Document standards also encouraged closer attention to structure. The W3C’s Web Content Accessibility Guidelines 2.0, published in 2008, reflected a broader principle relevant to digitization: visual presentation alone is insufficient when content must be searched, reflowed, or used with assistive technology. A PDF could look faithful while lacking the logical reading order needed for accessible use.
Tables, forms, and the limits of plain text output
Tables made the gap between recognition accuracy and useful extraction especially clear. OCR might read every character in a financial table correctly while losing the relationship between a value and its row or column header. In the 2000s, table analysis often began by finding ruling lines, then locating intersections and cells. That approach worked for strongly ruled forms but broke down when tables relied on whitespace instead of borders.
Borderless tables required inference from aligned text baselines, recurring gaps, and consistent numeric patterns. A system might identify a vertical alignment of prices as one column and left-aligned product names as another. Mixed layouts remained difficult. Merged cells, multiline entries, footnotes inside tables, and sparse forms could all defeat geometric assumptions.
Forms introduced a different kind of structure. A system had to separate printed labels from handwritten or typed responses, identify checkboxes, and associate each answer with the right prompt. Template-based approaches compared a scanned form with a reference layout after registration. They worked well for stable, high-volume forms, but even small changes in design, scan scale, or page deformation required careful alignment and version control.
| Document type | Typical 2000s challenge | Useful structural cues |
|---|---|---|
| Newspaper | Irregular columns and advertisements | Whitespace, text texture, headline size |
| Scientific paper | Two columns, equations, figures, references | Margins, caption placement, font and alignment |
| Invoice | Variable layouts and tabular amounts | Keywords, label-value proximity, numeric patterns |
| Historical manuscript | Degradation and handwriting variation | Line contours, writer-specific features, contextual models |
Handwriting and historical material
Printed text was only one part of the decade’s document-analysis work. Handwritten documents posed a basic segmentation problem: letters within a word could touch, character shapes differed from writer to writer, and lines might curve across warped paper. Rather than requiring perfect character segmentation, many systems used holistic or segmentation-free methods. They represented a word image as a sequence of features and evaluated candidate transcriptions with hidden Markov models or related sequence models.
These methods connected document analysis with statistical techniques used in speech recognition. In both cases, the observed signal was variable and ambiguous, while the desired output was a structured sequence. A language model could favor likely word sequences, a lexicon could restrict candidates, and confidence estimates could identify cases for human review. The comparison had limits—page geometry has no direct equivalent in audio—but it helped methods circulate between research communities. For context on that parallel development, the blog’s account of early-2000s speech synthesis, joins, prosody, and HMM voices traces how sequence models shaped another recognition-adjacent field.
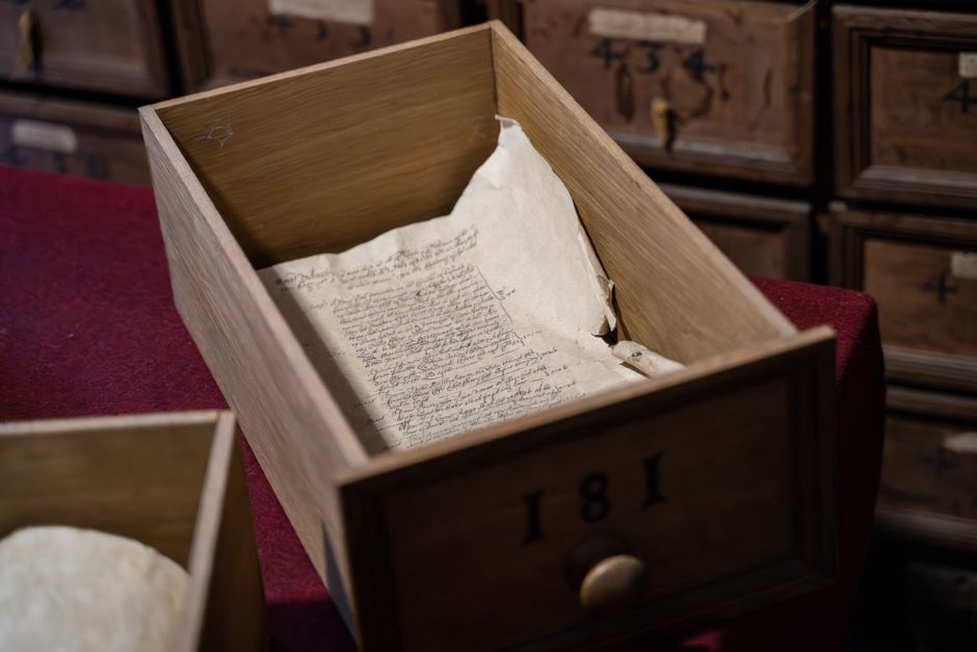
Historical collections raised preservation issues alongside technical ones. Bleed-through from the reverse side, faded ink, warped bindings, and nonstandard spellings could defeat systems trained on modern documents. Enhancement methods tried to suppress background interference and normalize contrast, but aggressive cleaning could erase punctuation, diacritics, or faint marginalia. Responsible digitization therefore retained master images and treated automated transcripts as derivative data rather than substitutes for the source artifact.
Retrieval, metadata, and human correction
The practical aim was often retrieval rather than perfect transcription. Full-text indexing made scanned collections searchable, while zone detection allowed repositories to search titles, authors, or captions separately. For difficult material, word spotting provided another option: retrieving visually similar word images without requiring a complete transcript. This was useful for handwritten archives, though it depended on carefully designed similarity measures and usually benefited from human validation.
Confidence scores became an important link between automation and review. Recognition engines could estimate uncertainty at character, word, or line level, while document systems could combine those estimates with structural warnings, such as an implausibly long text line or a missing table cell. Review interfaces could then prioritize pages or fields likely to contain consequential errors. In production work, selective routing was often more realistic than fully unattended processing.
What “accuracy” could hide
Character error rate and word error rate remained useful measures, but they could conceal failures that mattered to the task. A system that reads 99 percent of characters correctly may still mishandle every column boundary in a newspaper. On an invoice, an error in a total or date may matter far more than several mistakes in a supplier address. Evaluation therefore needed separate measures for zone classification, reading order, field extraction, table-cell assignment, and retrieval success.
- Define the intended use before choosing an accuracy measure.
- Keep page images alongside extracted text and structure.
- Test on the actual range of layouts, languages, scan conditions, and document ages.
- Review high-impact fields and low-confidence regions instead of sampling only easy pages.
This discipline remains visible in digitized proceedings and archives. A technical paper is not merely a bag of words: its title, author block, sections, figure captions, equations, references, and two-column reading order each serve different functions. When checking an older scan, compare the extracted text with the page image at structural transitions—column changes, table boundaries, captions, headers, and footnotes—where a fluent-looking OCR transcript is most likely to conceal a mistaken interpretation.