
A computer-aided detection mark on a mammogram was not a cancer diagnosis. It told the radiologist where to look more closely—perhaps at a faint cluster of calcifications. That distinction defined much of AI’s role in 2000s medical imaging. Software could find, measure, and prioritize visual evidence, but its clinical meaning still depended on the reader, the patient’s history, and often further tests.
Progress came less from a single breakthrough than from better digital images, faster scanners, more practical computing, and algorithms built for specific tasks. Researchers applied pattern recognition to mammography, chest CT, brain MRI, retinal photographs, and other studies. Some systems entered clinical use; many stayed in the lab. The most useful ones did something limited and concrete: flagged a possible lesion, estimated its size, or made comparisons between scans more consistent.
What “AI” meant in a 2000s imaging lab
Computer-aided diagnosis, or CAD, covered several kinds of help. Detection systems searched for suspicious locations; classification systems assigned a likelihood or category to a finding already located. Segmentation software traced an organ, tumor, or vessel, while registration software aligned images taken at different times or with different techniques. None of these outputs established a diagnosis on its own.
Most systems used hand-designed features with statistical classifiers. Engineers measured properties such as brightness, shape, texture, edge sharpness, and the arrangement of nearby pixels, then trained a model on examples labeled by experts. Neural networks were part of the research, but the large-scale deep learning familiar from the 2010s did not yet dominate medical imaging. Support vector machines, decision trees, and Bayesian methods commonly sat alongside rule-based image processing.
A typical detection pipeline first reduced irrelevant variation, perhaps correcting uneven illumination or suppressing noise. It then generated plenty of candidates under permissive rules: if a subtle lesion was missed here, no later classifier could recover it. A second stage rejected likely false positives using shape and texture features. The result might be a set of marks overlaid on the image, not a verdict about the patient. For more on the measurement side of this work, see early-2000s medical image analysis from scans to measurements.
Why new images created new workloads
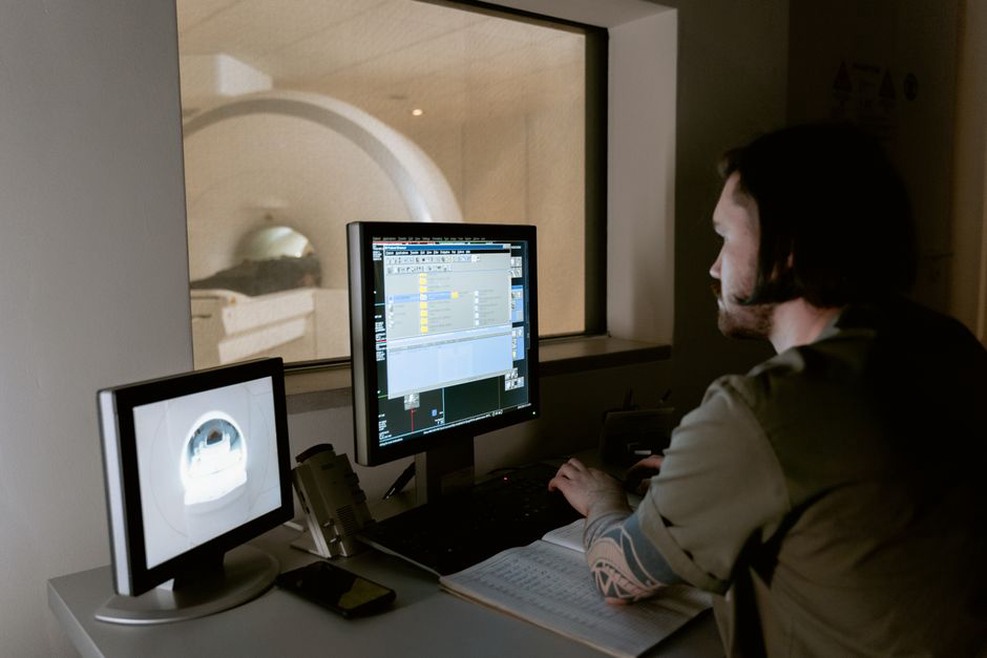
Medical imaging created both the opportunity and the workload. Digital acquisition made studies easier to process computationally, while CT scanners produced many thin slices from a single examination. Those slices revealed finer anatomical detail but gave readers more to inspect. MRI offered several contrasts of the same anatomy, and follow-up examinations called for comparisons over time. Image volume was growing faster than the time available to read each study.
Digital did not mean uniform. Scanner models, acquisition settings, contrast timing, slice thickness, and reconstruction methods all affected appearance. A system could encounter images unlike those in its training set even within one hospital. Digitized film mammograms added another source of variation; native digital mammograms followed a different acquisition path. An algorithm might mistake a change in how an image was made for a change in anatomy.
Mammography: prompts, not second opinions with certainty
Mammography was one of CAD’s most visible clinical uses. Systems looked for patterns associated with masses and microcalcifications, then placed marks for the radiologist to review. A useful mark could draw attention to a finding. Several marks on a normal examination, however, could take up reading time or prompt unnecessary follow-up. The absence of a mark could not clear a study, either: the radiologist still had to inspect the whole image.
Large clinical evaluations showed why laboratory detection results were not enough. A widely discussed 2007 New York Times report on a study of mammography CAD described concern that CAD use in community practice could increase callbacks and biopsies without improving cancer detection. That finding did not settle the value of every CAD design or reading arrangement. It did show that adding marks to a radiologist’s workflow was a clinical intervention whose effects had to be measured, not inferred from software performance alone.
Chest CT: searching a three-dimensional volume
In chest CT, a major research task was detecting pulmonary nodules. A nodule might occupy only a small part of a large scan, while a blood vessel viewed in cross-section could resemble a rounded lesion. Algorithms had to look across adjacent slices rather than simply find circles in one image. After generating possible nodules, they examined features such as three-dimensional shape, intensity, and connection to vessels.
Finding a candidate was not the same as interpreting it. A detected nodule was not necessarily malignant; assessment also depended on prior imaging and patient risk. A detector that found more nodules by placing many false marks could make review harder. Researchers often reported sensitivity at specified numbers of false positives per scan to make that trade-off visible.
From visible findings to quantitative evidence
Other advances were less conspicuous than a mark around a suspected lesion. Segmentation, registration, and change measurement turned images into quantities a clinician could examine. In brain MRI, researchers worked to separate tissues and identify lesions despite uncertain boundaries and varying intensities. In cancer imaging, outlining a tumor could support estimates of its size or volume. Follow-up scans needed alignment, or a small shift in patient position might look like anatomical change.
These tasks demanded different levels of precision. A boundary good enough to locate a lesion might be too rough to measure a small change in volume. A registration method might align large structures but leave local distortions near the area of interest. What mattered was whether the error was small enough for the intended clinical decision.
Retinal imaging offered another setting for specialized analysis. Researchers investigated automatic detection of features associated with diabetic retinopathy, including microaneurysms and other visible abnormalities. Small lesions, uneven illumination, and differences in camera quality made detection difficult. A system could help with screening by identifying images for review, but its evaluation had to count both missed disease and the burden of referrals for human assessment.
How researchers measured an imaging system
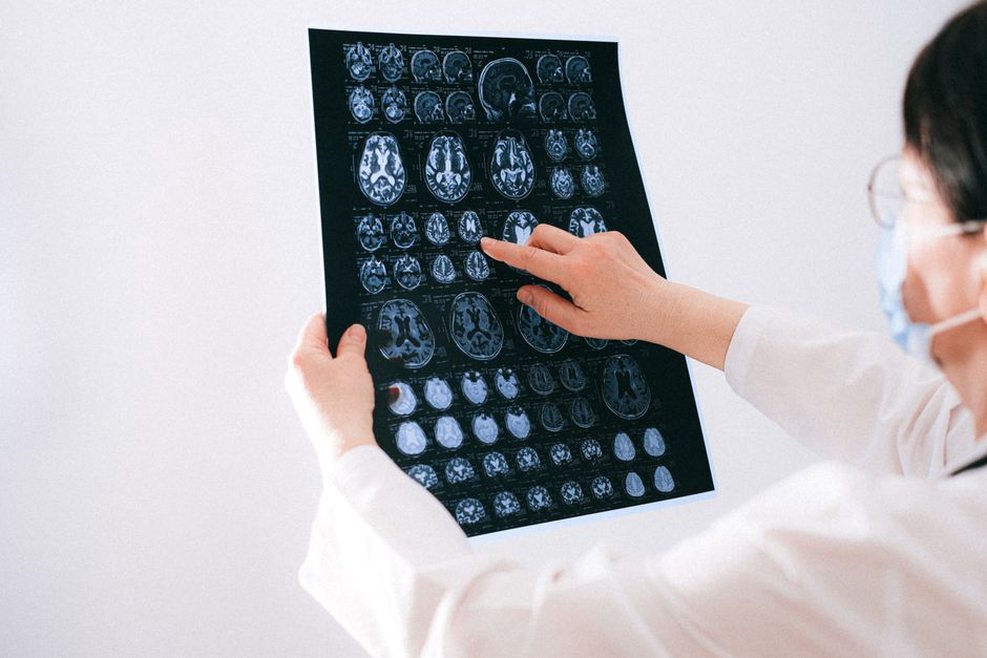
A model could look impressive on a selected image set and disappoint in practice. Evaluation had to distinguish success on an algorithmic task from benefit to patients. Four questions were especially important:
- What was the unit of analysis? Detecting a lesion, classifying an image, and assessing a patient are different outcomes. Multiple images from one patient are not independent test cases.
- What counted as the reference answer? Expert readings, follow-up imaging, pathology, and clinical records offer different kinds of evidence. Reader disagreement can make boundaries and labels uncertain.
- What was the operating point? A detector’s sensitivity changes with the threshold for issuing marks. Detection must be reported alongside its false-positive burden.
- Did the test resemble deployment? Results from selected images at one institution may not carry over to other scanners, patient populations, or routine cases.
Sensitivity and specificity were useful, but neither told the whole story. For a lesion detector, false positives per image or scan could be more revealing than a single accuracy figure. For CAD used by a radiologist, the test might compare decisions with and without assistance. Did cancer detection improve? Did recall rates change? Did reading take longer? Those are properties of the human–software workflow, not just the classifier.
Training and testing also needed a clean separation. Images from the same patient—or near-duplicate slices from one scan—in both sets could inflate apparent accuracy. Small datasets made it tempting to tune many features against the same examples. Testing at another institution was harder to arrange, but better at showing whether a method recognized a meaningful visual pattern rather than local imaging habits.
The limits that shaped clinical adoption
A neatly labeled benchmark could hide the ambiguity of real medical images. Normal anatomical variation, surgical changes, motion artifacts, and unusual disease appearances could all confuse a system. Rare but serious findings posed a particular problem: there might be too few examples to judge how an algorithm trained on more common appearances would behave.
Workflow mattered as much as recognition accuracy. A tool had to fit the reader’s viewing environment and show results at the right point in the examination. Marks needed to be understandable without taking over the image; measurements had to be consistent enough for follow-up comparisons. Processing time, image compatibility, and a clear response to software failure also determined whether a promising method was practical.
Regulatory clearance and clinical effectiveness were separate questions. Clearance for a specified use did not promise better outcomes in every setting. Nor did a disappointing result for one generation of CAD rule out computer assistance. The lesson was narrower: test the actual device with the task, readers, and patient population in which it would be used.
Where the decade’s contribution is easiest to see
Computers did not begin diagnosing patients from scans on their own. The 2000s instead established a workable chain connecting digital acquisition, candidate detection, image-derived measurement, reader-facing results, and clinical evaluation. Each link could fail differently. A classifier could not recover a lesion lost during candidate generation. A precise measurement meant little if follow-up scans were misaligned. Even a well-placed mark might not improve a reader’s decision.
Later AI work inherited those questions alongside the datasets and algorithms: Which reference standard is trustworthy? How much does scanner variation matter? What do false alarms do to clinical decisions? Consider two CT scans taken months apart. A tool may find a small pulmonary nodule in both, but estimating growth requires matching the same nodule, accounting for differences in acquisition, and reporting measurement uncertainty. Finding it is only the first step.